Standard Deviation
The square root of variancemathVarianceA measure of how widely results spread around the expected value. High for straight up, low for even-money bets.Read full →: the typical distance between a result and its expectation.

Per $1 staked, σ is 5.84 for a straight up and 1.00 for red. Multiply by the stake and by the square root of the number of spins for a session.
Rule of thumb
About two thirds of sessions land within one σ of the expectation and 95% within two. For 100 redbetRedEven-money bet on the 18 red numbers. French: rouge.Read full → spins at $10 (expected −$27, σ = $100) most sessions fall between −$127 and +$73, and almost all between −$227 and +$173. A result outside that range is not evidence of anything except that one session in twenty does it.
Why √N
Expected lossmathExpected lossExpected value times total amount wagered; the average amount lost over a session or a period.Read full → grows in proportion to N; spread grows in proportion to √N. For small N the spread dominates and sessions are coin flips with a slight lean. For large N the loss outruns the spread. The crossover, where expected loss equals one standard deviationmathStandard deviationSquare root of variance; the typical distance of a result from the expected value.Read full →, is at N = (σ/edge)² = (1/0.027)² ≈ 1,370 spins for even money and (5.84/0.027)² ≈ 46,800 for straight upsbetStraight upA single number, pays 35:1.Read full →. Below those numbers, luck decides; above them, the edge does.
Using it
To judge whether a session was unusual, compute (result − EV)/σ. A $10 red bettor who finishes 100 spins at +$150 is at (150 + 27)/100 = 1.77σ, a one-in-25 outcome: lucky, not remarkable. A straight-up bettor at the same +$150 is at 0.3σ: an ordinary night. The same dollar result means different things on different bets.
Standard error of a proportion
The same arithmetic tells you how many spins it takes to see the edge in the data. The standard error of an observed win proportion is √(p(1 − p)/N). For red with N = 1,000: √(0.4865 × 0.5135 / 1000) ≈ 1.6%. The gap between a fair coin and red is 1.35%, so after 1,000 spins you still cannot tell them apart with confidence. After 10,000 the standard error is 0.5% and you can. This is also why wheel-bias detection needs so many spins.
A caution on skew
Straight-up results are far from normally distributed in a short session: most sessions are a steady −$10 per spin with occasional +$350 jumps. The ±1σ rule describes the spread correctly but the shape poorly until N is in the hundreds. For even-money betsbetEven-money betRed/black, odd/even, high/low. 18 numbers, pays 1:1.Read full → the normal approximation is good from about 30 spins.
Formula
Questions
It is proof that you played about 40 sessions, or were in the lucky one in forty. Repeat it.
It swings less and less: the standard error of the average is σ/√N. By N = 10,000 it is 1% of the stake.
Fun with Math
Try these yourself first. Each solution is folded; open it when you are ready.
Over 100 spins of a European wheel, one unitmoneyUnitThe base stake a system or a player works in. Progressions are described in units so they apply at any table.Read full → on redbetRedEven-money bet on the 18 red numbers. French: rouge.Read full → is ahead with at least 51 wins, and one unit on a straight upbetStraight upA single number, pays 35:1.Read full → is ahead if its number hits at least 3 times. Use the bell curve to estimate both chances, then compare them with the exact answers.
Show the solution
Answer Red: the bell curve gives 35.6% and the exact answer is 35.5%. The straight up: the bell curve gives 55.0% and the exact answer is 50.9%. The shortcut works for red and misses for the single number.
Red: wins average 100 × 18/37 = 48.6, with a spread of √(100 × 18/37 × 19/37) = 5.0. Ahead means 51 or more; the halfway mark, 50.5, is 0.37 spreads above the average, and the bell curve puts 35.6% above that. Adding the exact chances of 51, 52 … 100 wins gives 35.5%.
Straight up: hits average 100/37 = 2.70, with a spread of √(100 × 1/37 × 36/37) = 1.62. Three or more hits means above 2.5, 0.12 spreads below the average: 55.0% by the bell curve. Exactly, it is 1 minus the chances of 0, 1 and 2 hits, 6.5% + 17.9% + 24.7%, which leaves 50.9%.
The bell curve needs plenty of results on both sides of the average. Red has them after 100 spins; a number that hits fewer than three times on average does not. The curve even gives 8.7% to “no hit”, where the true chance is 6.5%. Taylor (2021) sets the binomial and the bell curve side by side in the same way.
Comic relief
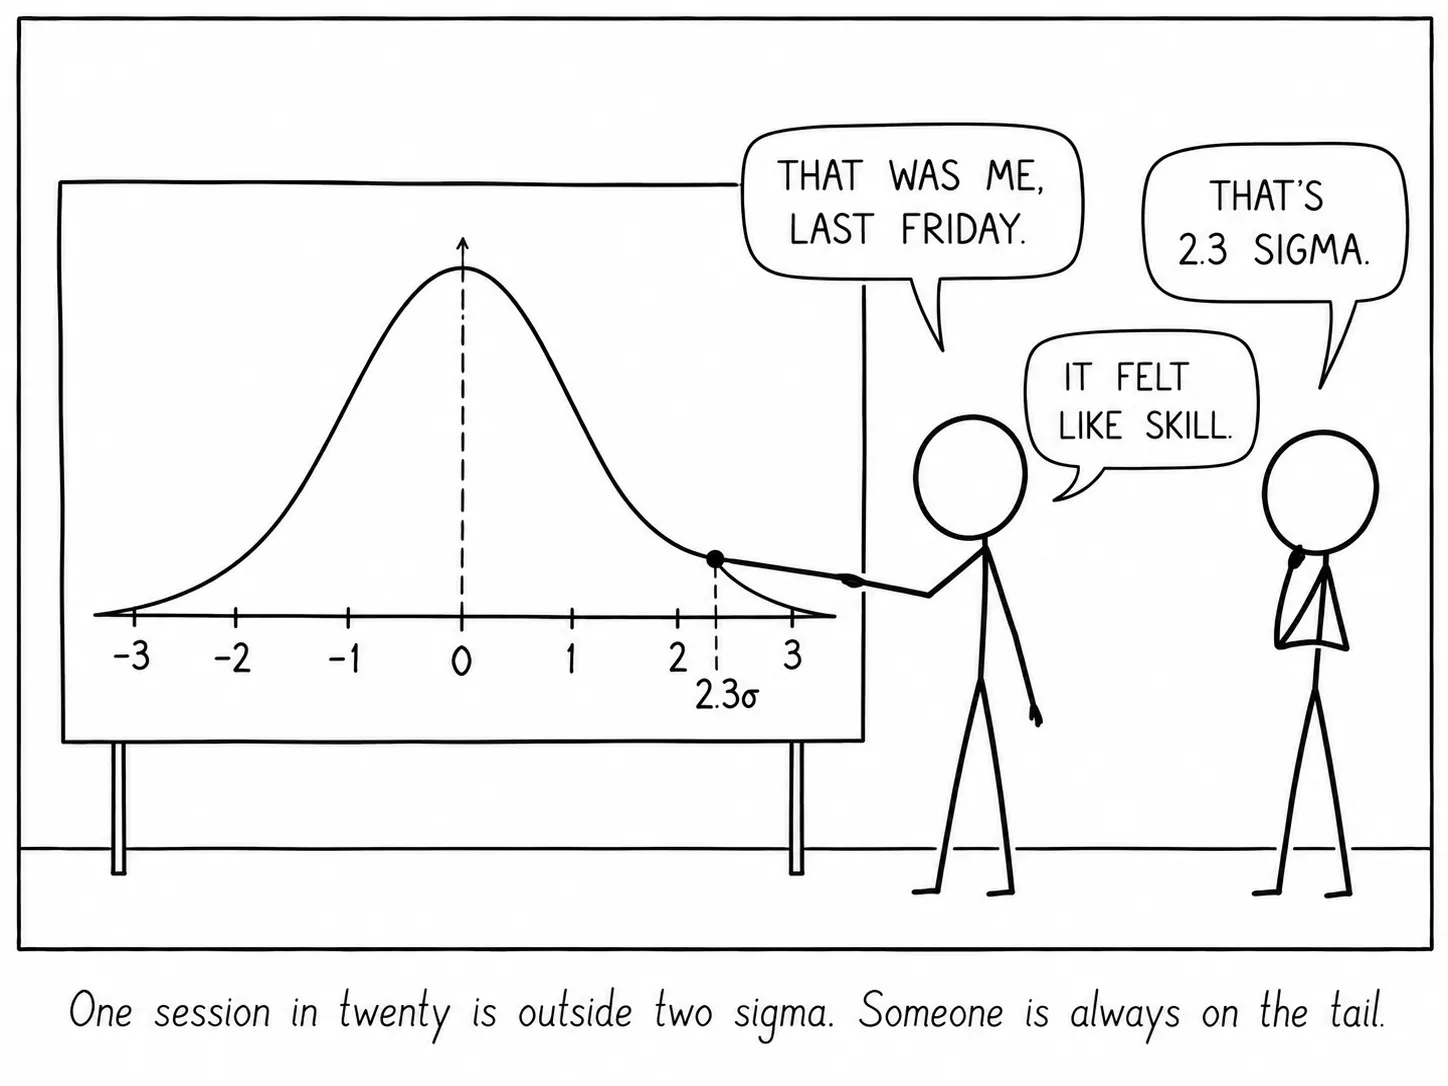
One session in twenty is outside two sigma. Someone is always on the tail.
Sources
- Feller, W. An Introduction to Probability Theory and Its Applications, Vol. 1.
- Ethier, S. N. The Doctrine of Chances: Probabilistic Aspects of Gambling.
- Taylor, D. G. Games, Gambling, and Probability: An Introduction to Mathematics, 2nd ed.